

Location-based scheduling (LBS) organizes work by physical zones within a project so trades move through space in a continuous sequence instead of stopping and starting. The main payoff is steadier crew productivity: work flows floor by floor, unit by unit, or segment by segment without gaps or pileups. Reach for LBS when a project has repetitive units, congested trade sequences, or a hard need for takt-driven flow, not on a one-off custom build with little repetition.
TL;DR:
- Zones should ideally represent a single crew's workload per takt cycle; overly large or small zones obscure problems or create unnecessary noise.
- Flowlines and lane overlaps allow immediate visual detection of work progress, stalls, or collisions, unlike the less detailed Gantt charts.
- Successful LBS implementation requires accurate zone mapping, stable crew sizes, and consistent daily updates with enforced lookahead routines.
- Buffering 5 to 10 percent of takt time helps crews adapt to real-world delays and prevents schedule collapse from unexpected disruptions.
- GPS-verified crew tracking ensures reliable flowline data, catching misLogged activity and maintaining takt discipline during project execution.
Table of Contents
- What Is Location-Based Scheduling, and What Do the Terms Mean?
- Gantt vs. LBS: When Each One Actually Earns Its Place
- The Building Blocks of a Location-Based Schedule
- How to Build a Location-Based Schedule Step by Step
- Tools, Data, and the Roles That Make LBS Stick
- Where LBS Adoption Goes Wrong, and How to Fix It Fast
- What the Research Says About LBS Performance
- A Planner's Honest Take on Piloting LBS
- How Clock-Me Keeps LBS Pilots Honest on Site
- Where to Go Deeper on Location-Based Scheduling
- Sources
What Is Location-Based Scheduling, and What Do the Terms Mean?
LBS breaks a project into a Location Breakdown Structure (LBS hierarchy), a set of zones such as floors, wings, or roadway segments, each sized to hold a meaningful chunk of repeatable work. Zone too big and you lose visibility into where problems hide; zone too small and the schedule turns into noise. A good rule of thumb: a zone should represent roughly one crew's workload for one takt cycle.
Each trade's progress through those zones gets plotted as a flowline, a diagonal line on a chart with time on one axis and location on the other. A steep, unbroken flowline means a crew is moving steadily through the building. A flat or broken one signals a stall.
Takt planning sets a fixed time interval, the takt time, during which every crew finishes its scope in one zone before moving to the next. Tactplan's practitioner guidance treats takt and location-based flow as intertwined disciplines: takt sets the rhythm, and the LBS provides the map that rhythm moves across.
Gantt vs. LBS: When Each One Actually Earns Its Place
Gantt and Critical Path Method (CPM) charts excel at high-level milestones, contractual dates, and dependency logic across an entire project. They answer "what's the deadline and what blocks what." They struggle to show whether five trades are about to collide in the same stairwell next Tuesday.
LBS answers that second question. It exposes gaps (zones with no scheduled work) and collisions (two trades competing for the same space) that a thousand-row Gantt chart buries. Tactplan's own analysis of flowline visuals notes that a well-built LBS covering a very large number of activities can fit legibly on a single page, something a comparable Gantt chart would need hundreds of pages to show.
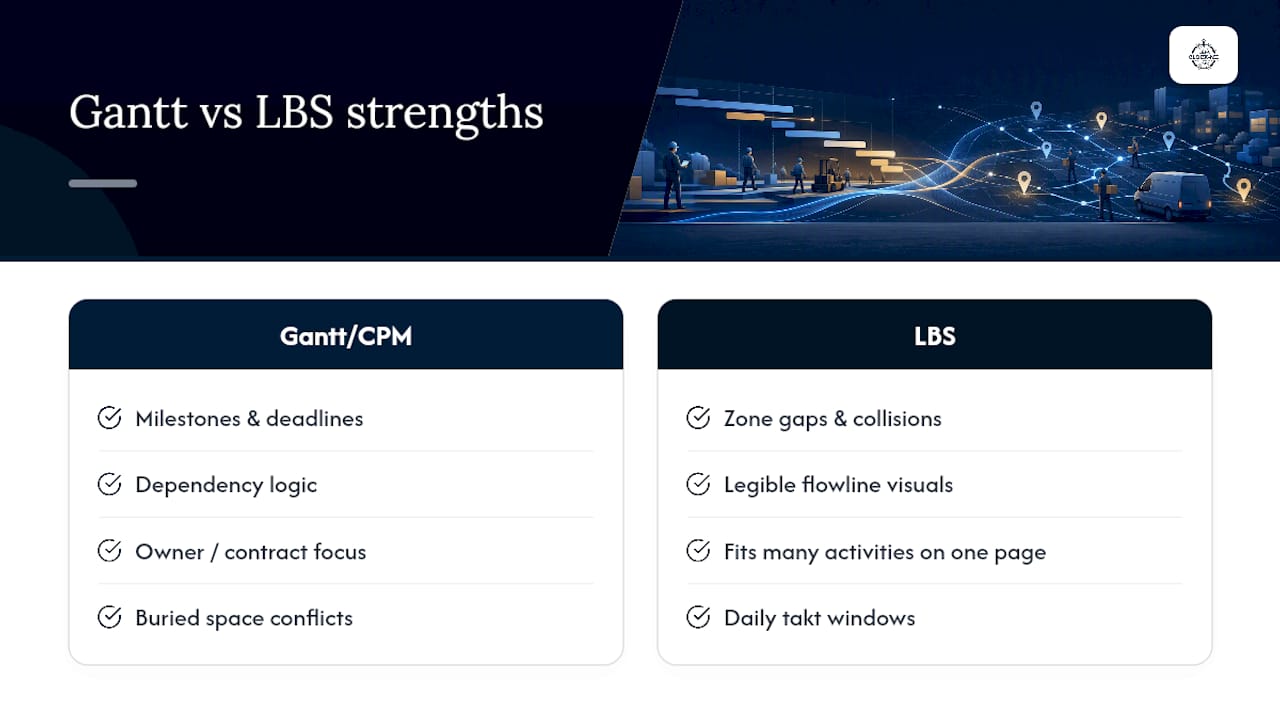
The two aren't rivals. Keep Gantt for owner milestones and contract dates, then nest LBS takt windows underneath for the repetitive fit-out, roadway, or unit-based phases where flow actually gets managed day to day.
The Building Blocks of a Location-Based Schedule
A working LBS is built from a handful of visual and structural pieces, and each one has a job:
- Location Breakdown Structure: the zone hierarchy (site, building, floor, unit) sized so each zone holds one crew's takt-cycle workload, not so fine it fragments the schedule or so coarse it hides problems.
- Flowlines: diagonal lines tracking each trade's movement through zones over time; slope and continuity reveal pace and stalls at a glance.
- Lanes: the horizontal or vertical bands representing each location, stacked so overlapping flowlines instantly flag potential collisions.
- Takt blocks: fixed-duration segments assigned to a crew in a zone, the atomic unit that keeps the whole rhythm synchronized.
- Crew allocation markers: showing which crew occupies which lane at which time, so a scheduler can spot double-booking before it happens on site.
Read together, these elements turn a schedule into something closer to a subway map than a spreadsheet. Gaps and crossings jump out visually in a way that a Gantt's endless task bars can't replicate.
How to Build a Location-Based Schedule Step by Step
Building an LBS from scratch follows a consistent sequence, whether you're scheduling a 12-story residential tower or a five-mile road resurfacing job.
- Map your zones. Divide the project into locations based on repeatable scopes: floors, apartment units, roadway stations, or utility segments. Size each zone to roughly one crew's output per takt cycle.
- Set your takt time. Look at historical production rates for your most repetitive trades (drywall, paving, piping) and pick a cadence, often one day, two days, or one week, that the slowest reasonable crew can sustain.
- Sequence the flowlines. Order trades so each one enters a zone only after the prior trade clears it, with a small buffer, and plot the resulting diagonal lines across your zone lanes.
- Assign crews and lock production rates. Commit to stable crew sizes per trade. Tactplan's guidance on adoption is blunt about this: without holding crew counts steady, the schedule loses its predictive value fast.
- Run a pilot. Simulate or physically test the sequence on a small phase, three or four zones, before rolling it across the whole project. Convert the pilot's actual output into your lookahead planning for the next phase.
Pro Tip: Build in a deliberate buffer, five to ten percent of takt time, for your first two or three cycles. Real crews are never as fast as the spreadsheet on day one, and a schedule with zero slack collapses at the first rain delay.
Tools, Data, and the Roles That Make LBS Stick
LBS software generally falls into three camps: dedicated takt/flowline platforms, hybrid tools that layer flowlines onto a traditional Gantt, and geo-scheduling systems built for dispersed field crews rather than fixed-site trades. GeoWise's approach to home-service scheduling clusters jobs geographically and scores routes to cut travel time, a different problem than zone sequencing but a useful comparison for multi-site infrastructure work. Mapline's geo-scheduling tools apply similar live-map, drive-time-aware assignment logic for spread-out field operations.
Whatever platform you choose, LBS runs on a few non-negotiable inputs and roles:
- Data inputs: an accurate zone map, verified crew production rates, material delivery windows, and known site constraints (access, permits, adjacent trades).
- Planner: owns the takt structure and updates the flowline model weekly.
- Foreman: feeds daily actuals back into the plan and flags emerging collisions.
- Site manager: runs the daily lookahead meeting where gaps get resolved before they become delays.
- KPIs to track: throughput rate per zone, percent planned versus percent achieved, count of open gaps, and number of detected collisions.
Where LBS Adoption Goes Wrong, and How to Fix It Fast
The most common failure is wrong-sized zones, either too coarse to reveal problems or so fine the schedule becomes unmanageable. Fix it by testing your first zone breakdown against one real trade's actual production data before committing.
The second failure is underestimating variability. Crews rarely hit their theoretical rate in week one, so a takt time with zero slack breaks almost immediately. Build the buffer in from the start, not after the first missed cycle.
A third failure is treating LBS as a planning-office document nobody on site actually reads. Enforce a daily lookahead ritual and keep the flowline chart visible where foremen see it.
- Symptom: repeated trade collisions in the same zones → Fix: check for uneven crew production rates and rebalance takt time before adding more crew.
- Symptom: gaps appearing mid-schedule → Fix: audit handoff timing between trades; buffers are usually too thin.
Pro Tip: If your flowline chart shows more than two collisions in a single week, stop and rebalance before the next takt cycle starts. Chasing a broken rhythm costs more than pausing to fix it.
What the Research Says About LBS Performance
Academic interest in location-driven scheduling isn't new. Research on transforming traditional construction into assembly-style processes ties location-focused planning to the same production thinking that manufacturing has used for decades. More recent work on integrated takt and location-based forecasting argues that combining the two approaches improves project reliability and shortens durations compared with either method alone.
On the industry side, Tactplan's vendor data reports construction time reductions of 10 to 20 percent and CO2 emission cuts of roughly 13 to 17 percent when projects switch from standard Gantt/CPM scheduling to location-based methods. Those are vendor-reported figures, not independently audited results, but they align with the core mechanism: eliminating start-stop behavior tends to reduce both wasted time and wasted energy on site.
A Planner's Honest Take on Piloting LBS
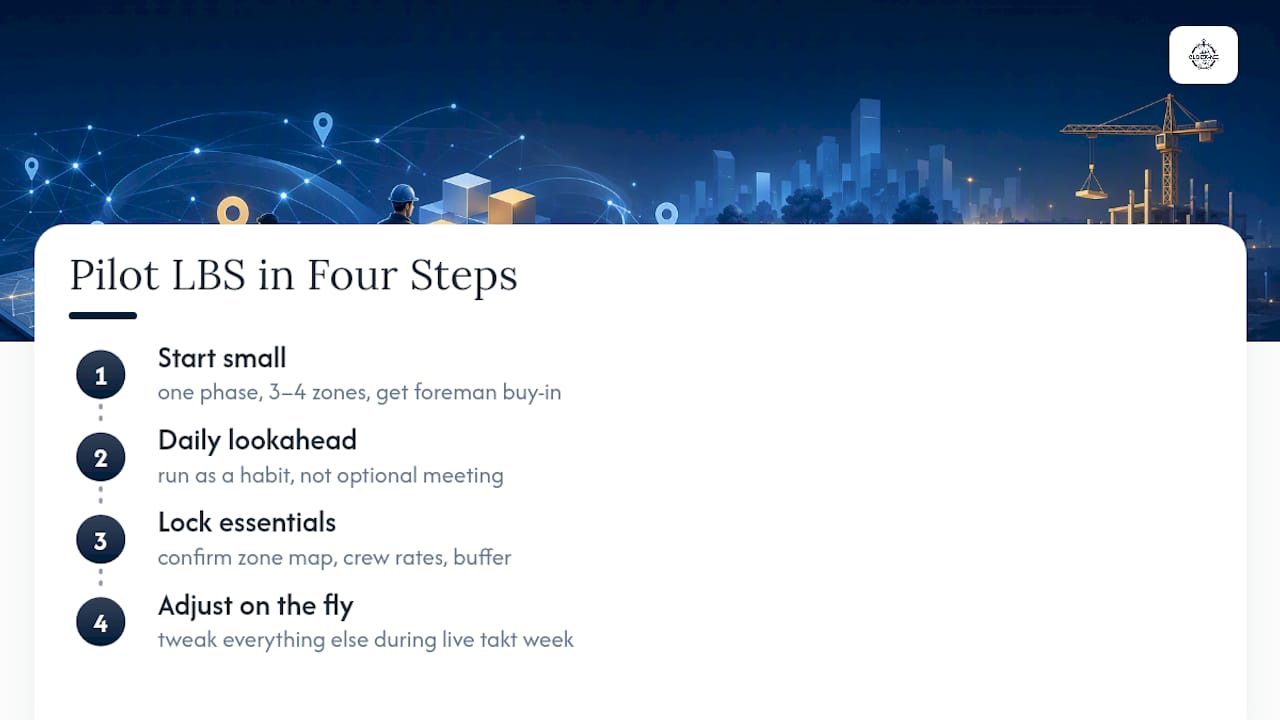
Start small. Pick one repetitive phase, three or four zones, and get the foreman's buy-in before you touch the master schedule. LBS fails fastest when it's imposed from the trailer instead of built with the people walking the floors.
Run the daily lookahead like a habit, not a meeting you skip when busy. Before your first live takt week, confirm your zone map, your crew rates, and your buffer are all locked. Everything else gets adjusted on the fly.
— Cristiano
How Clock-Me Keeps LBS Pilots Honest on Site
An LBS pilot only works if you actually know which crew was in which zone at what time, and paper logs or guesswork will quietly wreck your flowline data before week two. Clock-Me's GPS-verified punch clock and geofencing tools tie every clock-in to a real location, so when a flowline shows a crew stalled in Zone 3, you can check the live dashboard and confirm whether they were actually there or logged in from the parking lot.
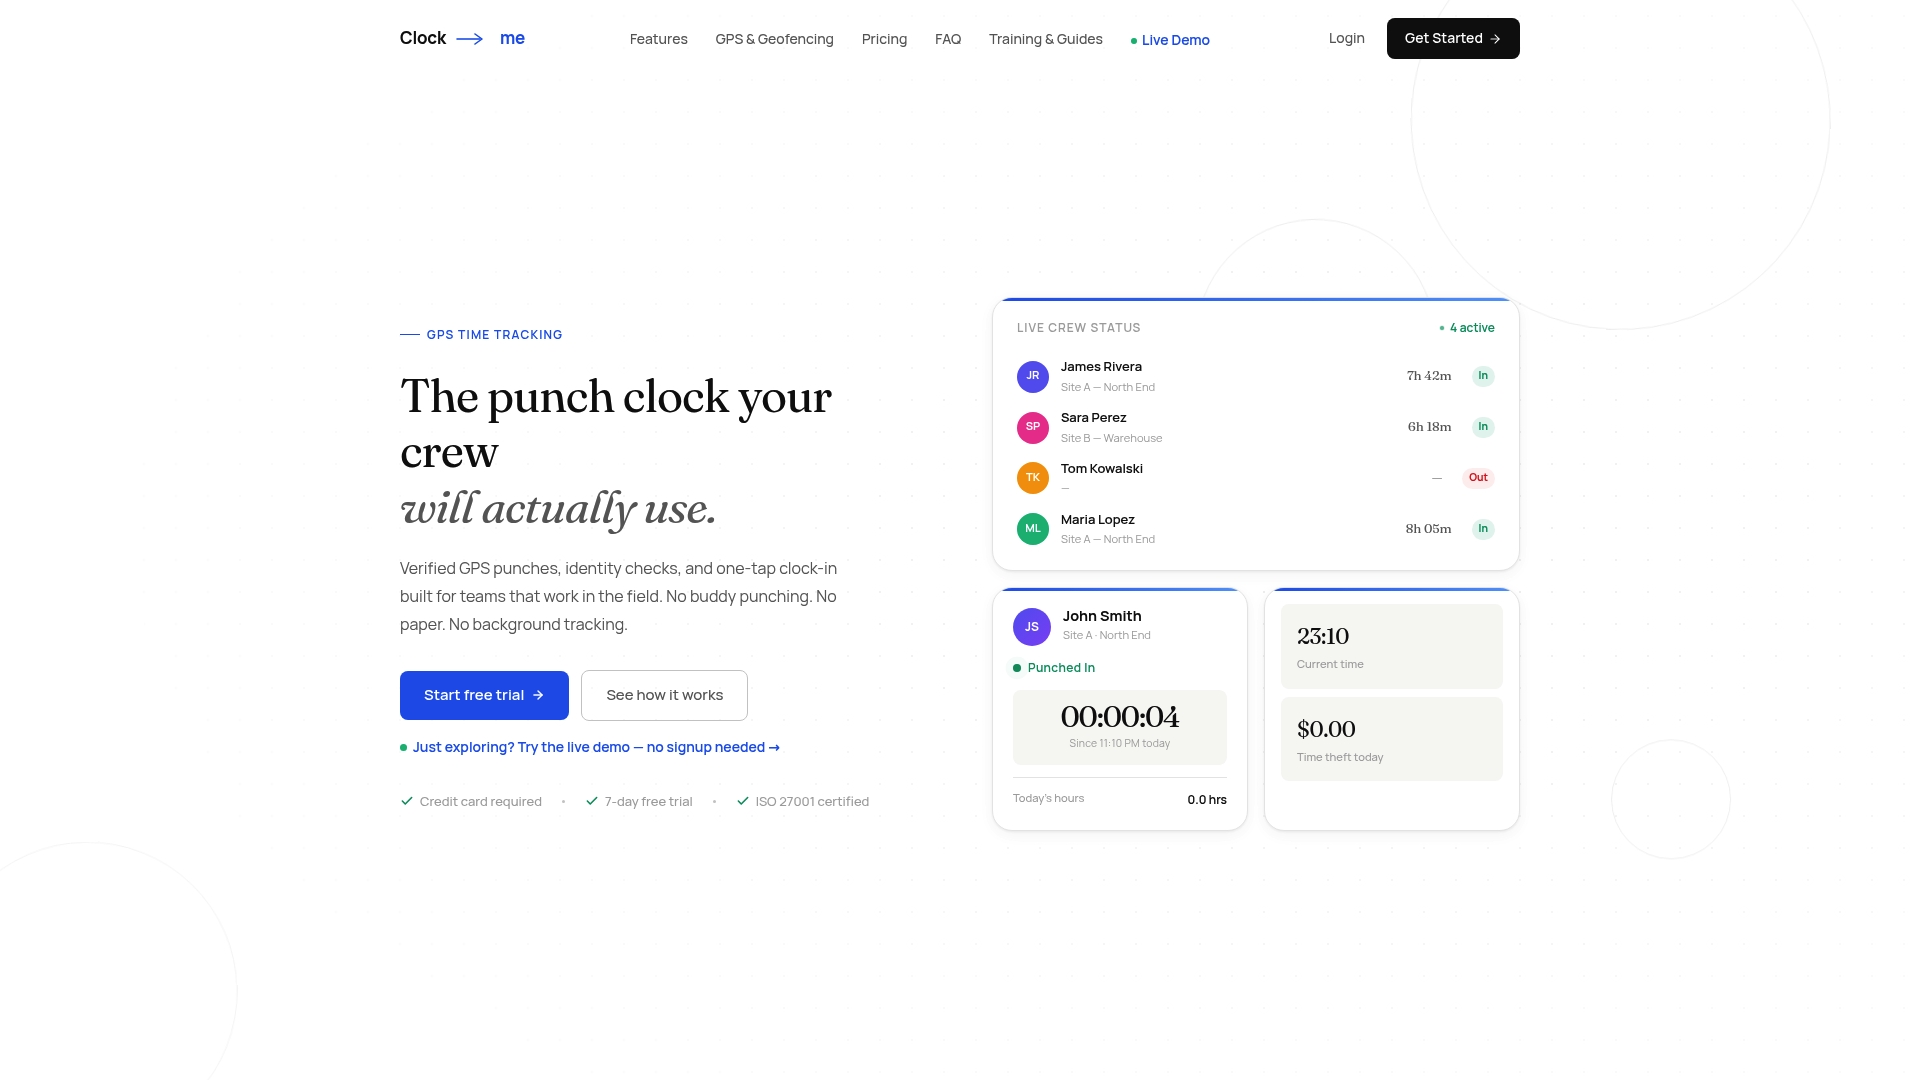
That location verification also catches buddy punching and gives site managers a real-time read on crew presence during the daily lookahead, exactly the routine that keeps takt cycles honest. Pair the live crew dashboard with your zone map and you get a fast cross-check against the schedule without adding paperwork to anyone's day. If you're planning your first takt week, set up a live demo and see how verified location data slots into your existing lookahead routine before you commit a full crew to the pilot.
Where to Go Deeper on Location-Based Scheduling
For further reading, Tactplan's LBS overview covers flowline mechanics and reported performance gains. The ASCE paper on integrated takt forecasting offers the academic backbone, and Loughborough's assembly-process research traces LBS thinking back to manufacturing roots.
Sources
- Tactplan Schedule - Location-based Scheduling | Tactplan
- Integrated Forecasting Approach for Takt and Location ...
- Location-Based Scheduling for Home Service Teams | GeoWise AI Scheduling Software